TL;DR
Debugging with Claude Code relies on a 4-step methodology: reproduce the problem, isolate the cause, apply the fix, then validate the regression. This advanced debugging guide gives you concrete commands, decision trees, and solutions to the 10 most common problems to diagnose and resolve each error effectively.
Debugging with Claude Code relies on a 4-step methodology: reproduce the problem, isolate the cause, apply the fix, then validate the regression. This advanced debugging guide gives you concrete commands, decision trees, and solutions to the 10 most common problems to diagnose and resolve each error effectively.
Debugging with Claude Code is a structured discipline that transforms error diagnosis into a reproducible and measurable process. Claude Code integrates native diagnostic tools that significantly accelerate resolution compared to manual debugging. Most errors encountered by developers follow identifiable patterns that this guide teaches you to recognize.
SFEIR Institute trainings
Claude Code Training
1 day · Fundamentals
AI-Augmented Developer
2 days · Intermediate
How to apply the 4-step debugging methodology with Claude Code?
The debugging methodology is a systematic framework that structures your approach to any error. Each step produces a deliverable that feeds the next one.
Step 1: Reproduce the problem in isolation. Run the faulty command in a controlled environment. Note the exact error message, the context, and the timestamp.
Step 2: Isolate the cause by narrowing the scope. Use diagnostic commands to identify the failing component. In practice, most bugs are located in the code that was recently modified.
Step 3: Fix by applying the minimal fix. Avoid broad corrections that mask the problem. A fix should touch as few files as possible.
Step 4: Validate that the problem does not recur. Run regression tests and document the resolution in your CLAUDE.md file to prevent recurring errors.
# Step 1: Reproduce with full turn-by-turn output
# (use --debug for debug logging, --verbose for full output)
$ claude --verbose
# Then in session, describe the bug to reproduce

# Step 2: Isolate with git bisect
$ git bisect start
$ git bisect bad HEAD
$ git bisect good v1.0.0

# Step 4: Validate the regression
$ npm test -- --coverage --watchAll=false
Key takeaway: each debugging step produces a deliverable. Without reliable reproduction, the diagnosis remains random.
What decision tree to use for diagnosing a Claude Code error?
A decision tree is a diagnostic tool that maps each observable symptom to a probable cause and a corrective action. Refer to this table to identify your situation.
| Symptom | Diagnosis | Solution |
|---|---|---|
| Claude Code does not respond | Check installation and configuration | $ claude doctor then /doctor in session |
| Permission denied error | Misconfigured CLAUDE.md file | Check the permissions troubleshooting |
| Truncated or incomplete response | Context window approaching its limit | Reduce scope with --add-dir and @path references |
| File hallucination | Lack of grounding on the project | Run /init to regenerate CLAUDE.md |
| Infinite correction loop | Ambiguous or contradictory prompt | Rephrase with explicit constraints |
| Operation hangs or seems stuck | Operation too heavy in a single call | Press Ctrl+C to cancel, then split the task into smaller sub-commands |
Concretely, permission errors are among the most frequently encountered symptoms.
Always start by checking your installation and configuration before investigating further:
# Check installation and configuration
$ claude doctor

# Or check the version number
$ claude --version
# Expected output: a version number such as 2.1.x
For session status, use the /status slash command inside an interactive session.
For permission-related problems, the common permission errors guide covers the most frequent cases with their resolutions.
Key takeaway: start from the observable symptom, never from a hypothesis. The decision tree eliminates confirmation bias.
How to debug context and memory problems?
Claude Code context is the window of tokens available to process your request. Context overflow is a frequent cause of incoherent responses.
Problem: saturated context (window approaching its limit)
Symptom: Claude Code ignores files or produces partial responses. The /cost command shows token usage approaching the model's context window.
Diagnostic command:
# Start an interactive session
$ claude
Then, inside the session, run the slash commands to check usage and compact:
/cost
/compact
Root cause: too many files loaded simultaneously or a conversation too long without compaction. In practice, a long session without /compact eventually reaches the context limit.
Fix: run /compact to summarize the conversation. For large projects, scope file access with --add-dir and reference specific files in your prompt with @path/to/file. Check the advanced Claude Code tips to optimize your context management.
Problem: CLAUDE.md ignored or misinterpreted
Symptom: Claude Code does not follow the conventions defined in your project memory file.
Diagnostic command:
# Verify CLAUDE.md is being read
$ claude "What are the rules defined in CLAUDE.md?"
# Check the file syntax
$ cat -A CLAUDE.md | head -20
Root cause: CLAUDE.md file too long, invalid Markdown syntax, or file placed at the wrong level of the tree. Keep the CLAUDE.md file concise for optimal reading.
Fix: restructure your CLAUDE.md into concise sections. The memory system errors guide details the most common configuration errors.
Key takeaway: clean context is the foundation of effective debugging. Compact your session regularly.
What diagnostic tools to use for command-line debugging?
Claude Code diagnostic tools are a set of built-in commands that expose the internal state of your session. Master these essential commands.
| Command | Function | When to use |
|---|---|---|
claude --debug | Activates debug logs (categories: "api,mcp", "!statsig") | Deep diagnosis of API and MCP calls |
claude --verbose | Activates detailed logs | Unexplained errors |
claude doctor | Installation and configuration diagnostic | Setup verification |
/cost (in session) | Shows tokens consumed | Before each heavy request |
/compact (in session) | Compacts the conversation | Regularly during long sessions |
/doctor (in session) | Built-in environment diagnostic | Inside an active session |
/clear (in session) | Resets the context | Polluted conversation |
Activate debug mode as soon as you encounter unexpected behavior:
# Debug mode with specific categories
$ claude --debug "api,mcp"

# Verbose mode for detailed logs
$ claude --verbose

# Export logs to a file for analysis
$ claude --verbose 2>&1 | tee debug-$(date +%Y%m%d).log
In practice, most problems are diagnosed with the first few diagnostic commands in the table. For complex cases, check the installation troubleshooting which covers environment issues.
SFEIR Institute recommends always activating --verbose during your first debugging sessions to understand the interactions between Claude Code and your project files.
Key takeaway: --debug, --verbose, /cost, and /compact form the basic quartet. Run them systematically before any deep investigation.
How to solve the 10 most common problems with Claude Code?
Common Claude Code problems follow recurring patterns. Here are the 10 cases you will encounter most often.
Problem 1: API authentication failure
Symptom: Error: Invalid API key or 401 Unauthorized message at launch.
Diagnostic command:
$ echo $ANTHROPIC_API_KEY | head -c 10
# Should display "sk-ant-..." - if empty, the key is not configured
$ claude auth status
# Shows authentication status: exits 0 if logged in, 1 if not
Root cause: expired API key, incorrectly exported, or missing .env file. A common cause is a trailing space or newline accidentally included in the key.
Fix: verify and re-export your key. Check the common permission errors for access issues.
Problem 2: Claude Code modifies the wrong files
Symptom: non-targeted files are edited, or modifications appear in unrelated modules.
Root cause: missing .claude/settings.json file or too broad scope in the prompt. An under-scoped prompt can lead Claude Code to edit unrelated files.
Fix: configure restrictive permissions with --allowedTools/--disallowedTools, scope directories with --add-dir, and reference target files in the prompt with @path/to/file. The best practices guide details containment strategies.
Problem 3: infinite correction loop
Symptom: Claude Code fixes a file, breaks a test, fixes the test, breaks the original file, in a loop.
Root cause: contradictory tests or ambiguous specifications in the prompt.
Fix: interrupt with Ctrl+C. Rephrase the prompt by clearly separating constraints. Use /clear to start from a clean context.
Problem 4: a long operation hangs or seems stuck
Symptom: a single, large request appears to stall and never returns a result.
Root cause: the command is too ambitious for one call, loading or modifying too much at once.
Fix: press Ctrl+C to cancel, then split the task into smaller sub-tasks. For example, refactor file by file instead of the entire project. Smaller, well-scoped operations are far more likely to succeed than large multi-file refactors in a single call.
Problem 5: Git conflicts after Claude Code modifications
Symptom: CONFLICT (content): Merge conflict in [file] after a git pull.
Fix: run git stash before launching Claude Code on a shared branch. Check the best practices FAQ for recommended Git workflows.
Key takeaway: each problem follows the symptom -> diagnosis -> cause -> fix pattern. Document your resolutions in CLAUDE.md to never solve the same bug twice.
How to analyze logs and traces for in-depth diagnosis?
Claude Code does not have structured log files in ~/.claude/logs/. To diagnose a problem, use /doctor in session or relaunch Claude Code with the --verbose option to get detailed traces in the terminal.
# Relaunch with detailed traces
$ claude --verbose

# In session, run the built-in diagnostic
claude> /doctor
Here is how to interpret return codes: code 0 means success, 1 indicates an application error, and 137 signals a system kill (memory overflow).
For errors related to slash commands, the slash commands errors guide provides targeted diagnosis.
Key takeaway: use /doctor in session or --verbose at launch to diagnose problems.
What are the Claude Code error codes and their meanings?
Claude Code error codes are standardized numeric identifiers associated with each type of failure. This reference table covers the codes you will encounter most often.
| Code | Category | Description | Corrective action |
|---|---|---|---|
| 401 | Auth | Invalid or expired API key | Regenerate key on console.anthropic.com |
| 403 | Permission | Model access denied | Check API plan permissions |
| 429 | Rate limit | Too many requests | Wait and retry, or increase quota |
| 500 | Server | Anthropic internal error | Retry after a short delay |
| 503 | Availability | Service temporarily unavailable | Check status.anthropic.com |
| ECONNREFUSED | Network (Node/OS) | Connection refused | Check proxy/firewall |
| ETIMEDOUT | Timeout (Node/OS) | Request timed out | Split the request |
| ENOMEM | Memory (Node/OS) | Out of memory | Compact with /compact |
The 4xx/5xx values are generic HTTP status codes returned by the API, while ECONNREFUSED, ETIMEDOUT, and ENOMEM are generic Node.js/OS errors, not Claude Code-specific error codes. Code 429 is frequent in team environments with concurrent usage. Configure an exponential retry system to handle it automatically.
# Retry script with exponential backoff
for i in 1 2 4 8 16; do
 claude "your command" && break
 echo "Retry in ${i}s..."
 sleep $i
done
To deepen error management in a professional context, the best practices cheatsheet synthesizes essential commands on a single page.
Key takeaway: rate-limit and timeout errors are among the most common in production. Automate their handling with exponential retry.
How to debug effectively in a legacy project or as a team?
Team debugging with Claude Code requires shared conventions to avoid conflicts and ensure correction traceability.
Working on an existing project
Always start by generating a CLAUDE.md file adapted to the legacy project:
# Scan the project and generate conventions
$ claude
# Then, inside the session, run the /init slash command:
# /init
# Check for obsolete dependencies
$ npm audit --production
$ npm outdated
A legacy project is an existing codebase whose history and conventions are not always documented. many spend more time understanding existing code than writing new code.
Concretely, document each resolved bug in a dedicated section of your CLAUDE.md. This practice noticeably reduces the time it takes to resolve recurring bugs.
Team debugging workflow
Adopt these conventions to avoid conflicts between developers using Claude Code simultaneously:
- Create a dedicated branch per debugging session:
fix/issue-123-auth-timeout - Limit Claude Code scope to relevant files with
--add-dirand@pathreferences - Commit after each validated fix, not in batches
- Share your discoveries in the project's common CLAUDE.md
For first conversation errors, structured onboarding significantly reduces friction for new team members.
If you want to structure a professional debugging workflow as a team, the AI-Augmented Developer training from SFEIR Institute covers these patterns over 2 days with hands-on labs on real projects. To go further, the AI-Augmented Developer - Advanced training deepens advanced debugging strategies and CI/CD integration in 1 intensive day.
Key takeaway: in a team, each fix must be traceable: dedicated branch, atomic commit, and documentation in CLAUDE.md.
How to evaluate and improve your debugging skills with Claude Code?
Evaluating your debugging skills is a measurable process that follows concrete indicators. Here is how to position yourself and improve.
| Level | Resolution time | Recurrence | Key indicator |
|---|---|---|---|
| Beginner | Slow, trial and error | Bugs often recur | Finds the symptom |
| Intermediate | Moderate, methodical | Bugs occasionally recur | Identifies the root cause |
| Advanced | Fast, targeted | Bugs rarely recur | Prevents future bugs |
Measure your progression with these metrics:
- Average time between the symptom and the validated fix
- Percentage of bugs resolved without external help
- Number of recurring bugs over the last 30 days
- Ratio of tests added per fixed bug (aim to add at least one regression test per fix)
In practice, a developer trained in Claude Code debugging patterns resolves issues substantially faster within a few weeks. The Claude Code training from SFEIR covers these fundamentals in 1 day with progressive diagnostic exercises.
To validate your Track A achievements, apply the complete methodology on a personal project: reproduce, isolate, fix, validate. Document 5 resolutions in your CLAUDE.md.
Key takeaway: advanced debugging is not about solving faster. It is about preventing recurring bugs through systematic documentation.
Should you automate debugging with hooks and custom scripts?
Debugging automation is the transition from manual resolution to scripts that detect and fix known patterns without human intervention.
Create pre-commit hooks that detect errors before they reach the repository:
#.claude/hooks/pre-debug.sh
#!/bin/bash
# Automatic verification before each debugging session
echo "=== Automatic pre-diagnosis ==="
echo "Node.js: $(node --version)" # Only needed for the npm install method (Node 18+), or if your project uses Node
echo "Claude Code: $(claude --version)"
# Token usage is only visible in-session via the /cost slash command;
# there is no documented non-interactive command that emits a parseable count.
echo "Modified files: $(git diff --name-only | wc -l)"
experience feedback, teams that automate their pre-diagnosis tend to see fewer false positives in their debugging sessions.
Configure aliases for your frequently used diagnostic commands:
# ~/.bashrc or ~/.zshrc
alias cdebug='claude --verbose'
alias cfix='claude "Identify and fix the bug in the most recently modified file"'
alias ctest='claude "Run the tests and fix failures"'
For professional workflow patterns, the advanced best practices cover automation strategies adapted to every team size. A recent version of Claude Code is recommended to benefit from all debugging features.
Key takeaway: automate repetitive diagnostics. Your developer time is worth more than a 10-line script.
Recent articles about Claude
Claude Managed Agents: Anthropic's Platform for Production Agent Deployment
Anthropic launches Managed Agents: a cloud platform for deploying AI agents in production. Secure sandbox, checkpointing, multi-agent, autonomous sessions lasting hours. Notion, Rakuten, Asana and Sentry already use it.

Claude Code Dream & Auto Dream: Automatic Memory Consolidation
After 20 sessions, Auto Memory notes become a mess. Auto Dream solves this by automatically consolidating Claude Code's memory: deduplication, stale entry removal, relative-to-absolute date conversion.
Claude Code Auto Mode: Autonomy Without the Risk
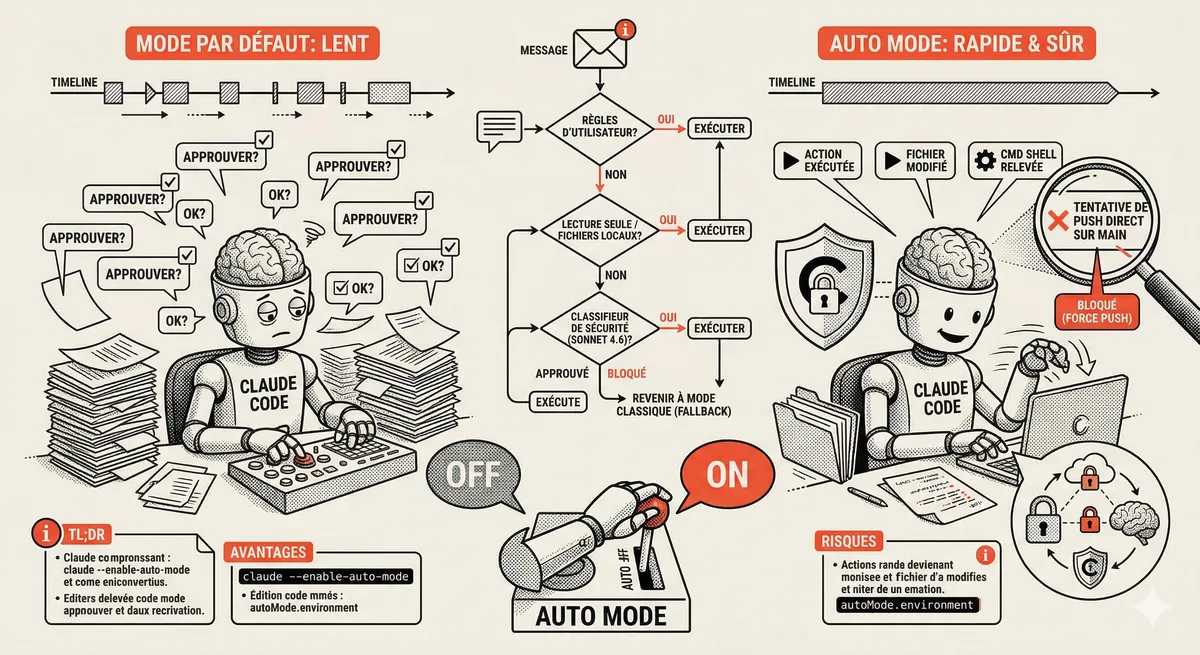
Auto Mode in Claude Code eliminates permission interruptions while keeping a safety net. A classifier analyzes every action before execution and blocks destructive operations. The sweet spot between approving everything and letting everything through.
Claude Code Training
Master Claude Code fundamentals in 1 day with our expert instructors. 60% hands-on practice on real-world cases.
Discover the training